데이터 분석 1일차 - 선형회귀 분석
Higher Hope.
데이터 분석 - 선형 회귀 분석 1일차
지도 학습 문제에서 모델의 매개변수를 계산하기 위해 훈련 데이터를 사용한다는 것을 알았다. 훈련 데이터는 설명 변수를 관측한 데이터와 그에 상응하는 반응 변수로 이뤄진다. 모델은 처음 보는 데이터에 대해서도 설명 변수로 보고 반응 변수를 예측할 수 있다. 회귀 문제의 목표는 연속 반응 변수의 값을 예측하는 것이었다.

훈련 벡터에 대한 결과 치는 위와 같음
# "np" , "plt"는 각각 NumPy 와 Matplotlib의 약칭으로 자주 사용된다.
import numpy as np
import matplotlib.pyplot as plt


# X는 훈련데이터의 특징이고, 여기서는 피자의 지름이다.
# scikit-learn은 특징 벡터 이름을 X로 사용한다.
# 대문자는 행렬을 의미하고 소문자는 벡터를 의미한다.
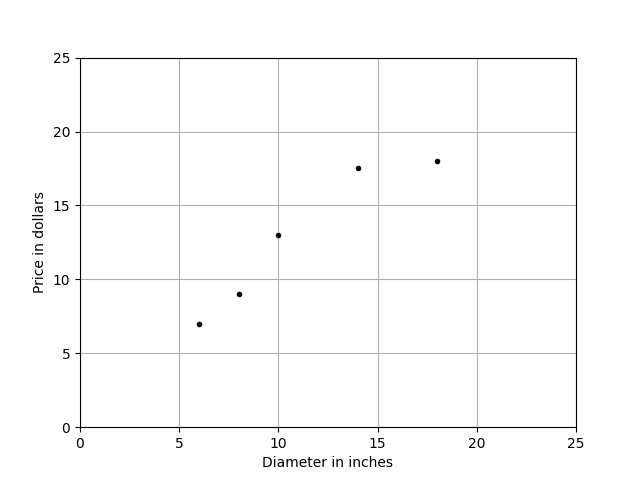
X = np.array([[6], [8], [10], [14], [18]]).reshape(-1, 1)
y = [ 7, 9, 13, 17.5, 18 ] # y 피자가격을 나타내는 벡터이다.

plt.figure()

# TODO 코드가 에러가 발생함.
# Traceback (most recent call last):
#   File "D:/GIT/sample/sample/python/python_deeplearning/dataanalysys_20210811.py", line 13, in <module>
#     plt.there('Pizza price plotted against diameter')
# AttributeError: module 'matplotlib.pyplot' has no attribute 'there'

#plt.there('Pizza price plotted against diameter')

plt.xlabel('Diameter in inches')
plt.ylabel('Price in dollars')
plt.plot(X, y, 'k.')
plt.axis([0, 25, 0, 25])
plt.grid(True)
plt.show()
이슈사항
- matplotlib - 3.4.2 버전 - 아래의 이슈가 존재함.
# TODO 2021-08-11 코드가 에러가 발생함. - there 함수가 아무래도 존재하지 않는듯 - import matplotlib.pyplot as plt 버전 확인 필요
# Traceback (most recent call last):
#   File "D:/GIT/sample/sample/python/python_deeplearning/dataanalysys_20210811.py", line 13, in <module>
#     plt.there('Pizza price plotted against diameter')
# AttributeError: module 'matplotlib.pyplot' has no attribute 'there'

#plt.there('Pizza price plotted against diameter')